Introduction
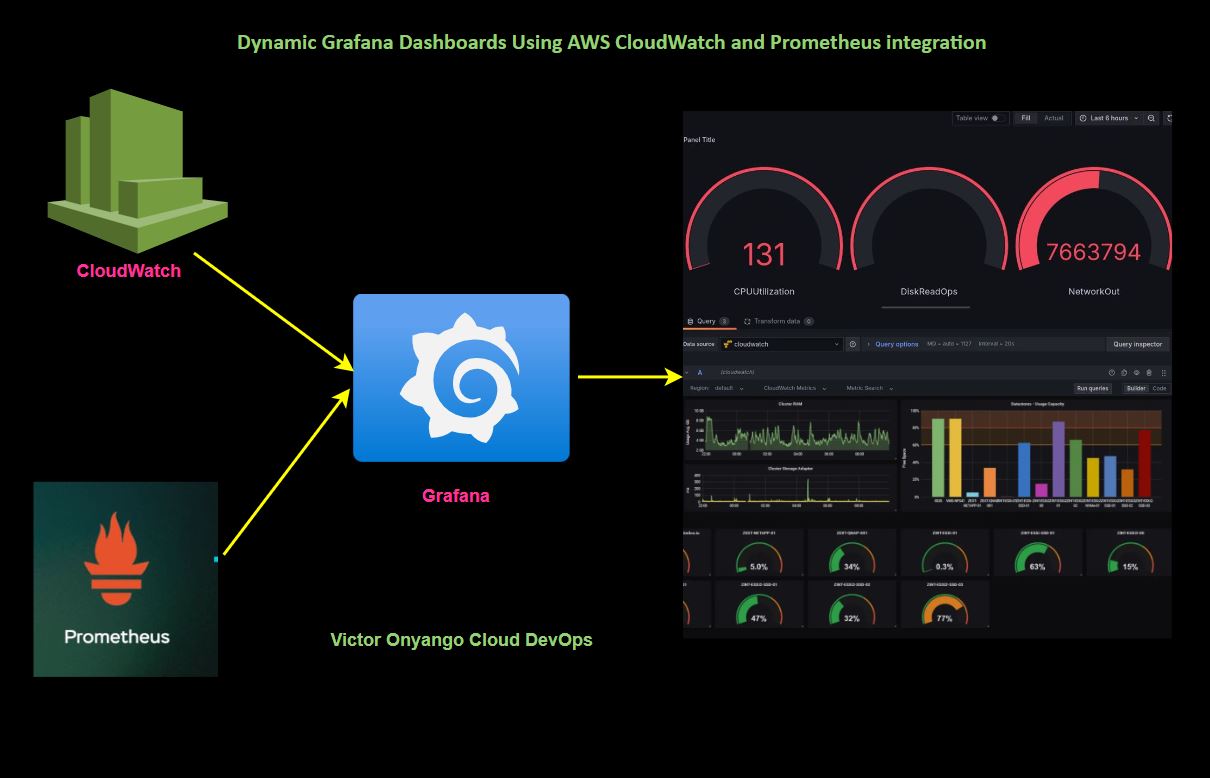
In a data-driven world, effective monitoring and visualization of system performance are essential. Grafana, an open-source analytics platform, enables users to create dynamic dashboards that display real-time data from various sources. By integrating AWS CloudWatch and Prometheus, you can gain valuable insights into your applications and infrastructure. This guide will demonstrate how to build interactive Grafana dashboards that combine metrics from both tools.
What is Grafana?
Grafana is an open-source platform designed for monitoring and observability. It allows users to query, visualize, alert, and explore metrics no matter where they are stored. By integrating with various data sources, Grafana provides a unified interface to visualize data through interactive dashboards, making it an essential tool for DevOps and IT professionals.
Why Use Grafana?
Grafana is used to gain insights into system performance, track infrastructure health, and troubleshoot issues effectively. Its key benefits include:
Unified Dashboard: Combine data from multiple sources into a single dashboard.
Customizable Visualizations: Create and customize visualizations to fit specific monitoring needs.
Alerting: Set up alerts to be notified of critical issues as they happen.
Community and Plugins: Extensive community support and a wide range of plugins to extend functionality.
Ease of Use: User-friendly interface that allows for quick setup and configuration.
How Grafana Retrieves Data
Grafana connects to various data sources through plugins, which allows it to retrieve and display data. It supports many data sources, including Prometheus, Graphite, InfluxDB, Elasticsearch, AWS CloudWatch, and many others. Once connected, Grafana can query these data sources to fetch metrics and visualize them through different panels, such as graphs, charts, tables, and heatmaps.
Benefits of Using Grafana
Real-Time Monitoring: Get real-time insights into your infrastructure and applications.
Enhanced Troubleshooting: Quickly identify and diagnose issues through comprehensive visualizations.
Scalability: Handle large volumes of data across numerous data sources efficiently.
Collaboration: Share dashboards and insights with team members to facilitate collaborative problem-solving.
What We Will Learn
In this project, you will:
- Set up Grafana and connect it to AWS CloudWatch and Prometheus as data sources.
- Create dynamic, interactive dashboards to visualize metrics from your infrastructure.
- Monitor key performance indicators (KPIs) for your applications and services, such as EC2 instances and Docker containers.
- Gain insights into your system’s health and performance, enabling you to make informed decisions based on real-time data.
Step one: Launching EC2 Instance.
To launch an EC2 instance for running Grafana, you can follow these steps:
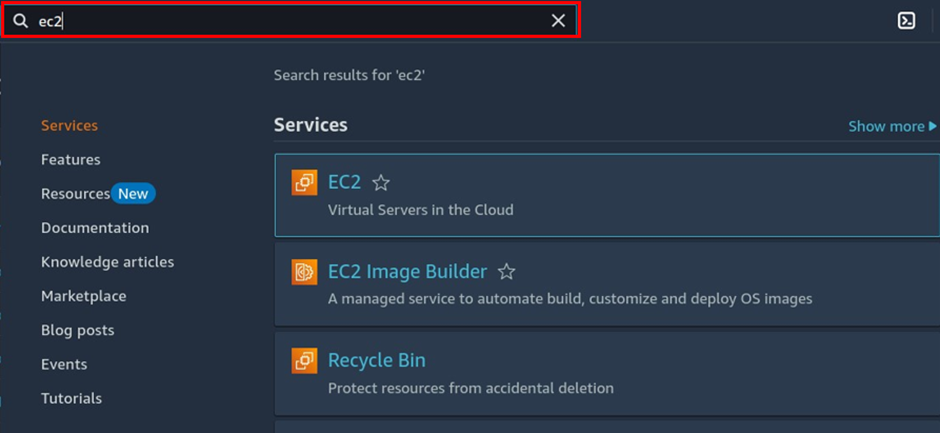
Log in to the AWS Management Console In the search bar type EC2 then select EC2 under services
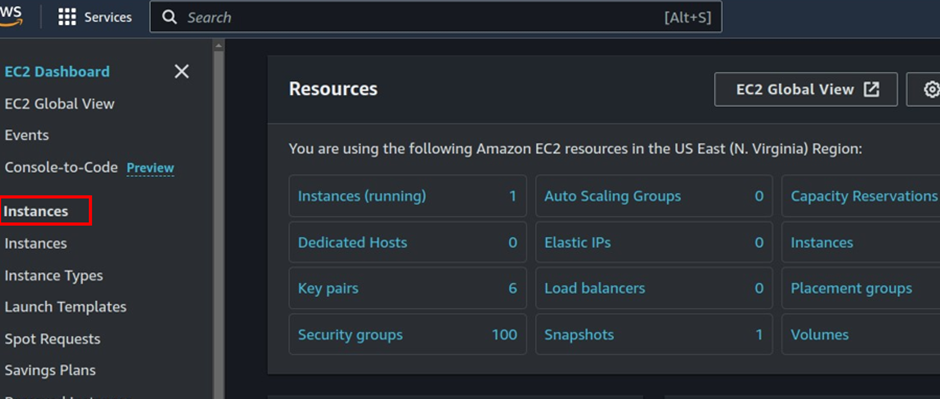
In the EC2 Dashboard, select Instances from the navigation panel on the left side.
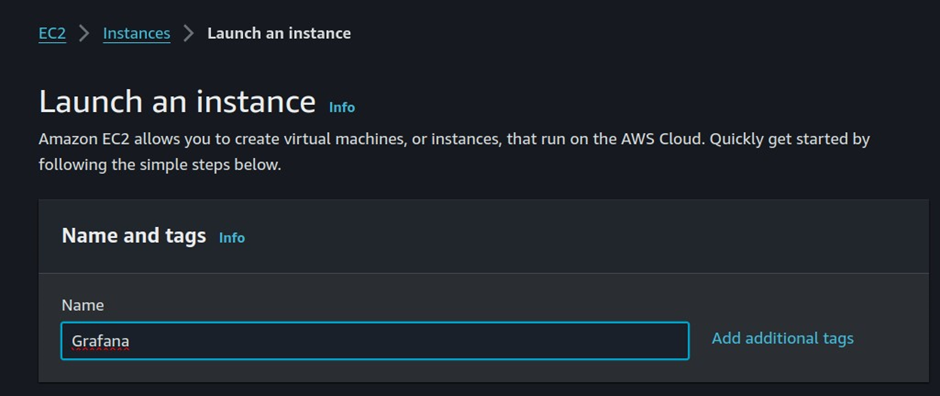
Click on the Launch Instances button.

Enter your preferred name for the instance in the name field.
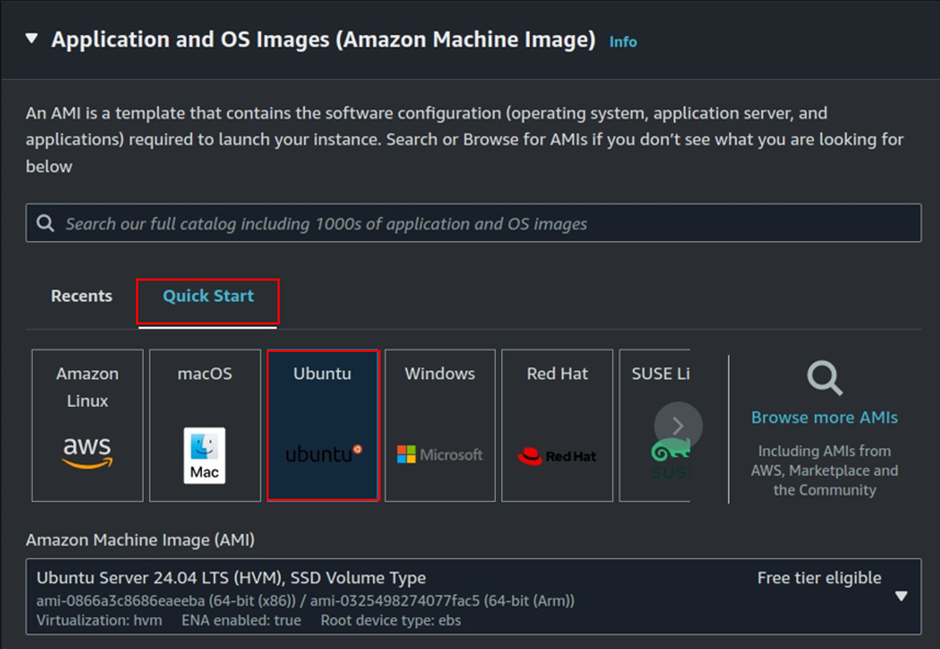
Under Application and OS Images, select the Quick Start tab, then choose your preferred AMI. For this setup, I will select Ubuntu.
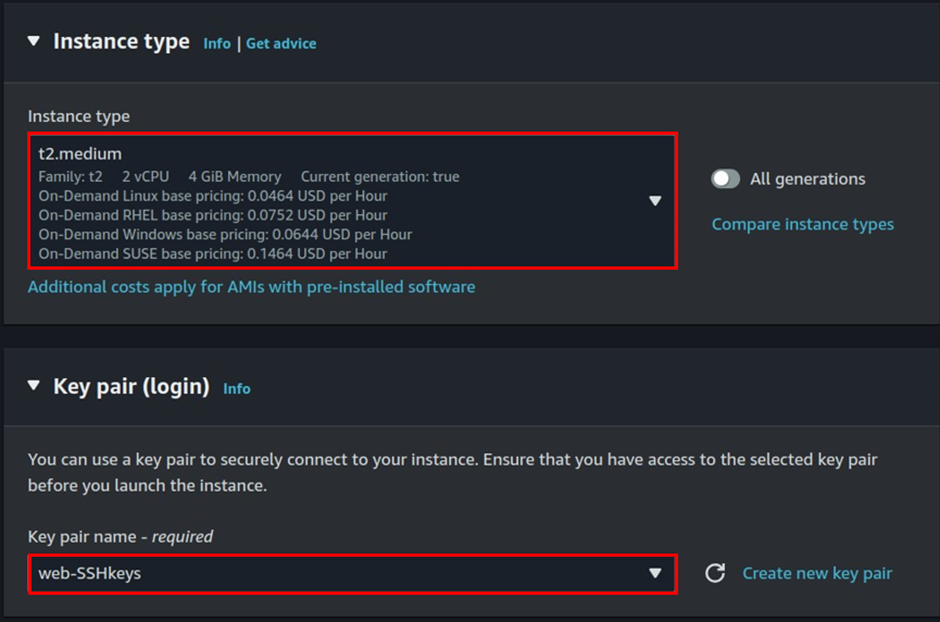
Under Instance Type, you can select t2. Micro, which is free tier eligible. However, for this project, I will choose t2. Medium; you can review the pricing accordingly.
Next, under Key Pair (login), select your existing key pair or click the Create New Key Pair button if you don’t have one. Scroll down to continue.
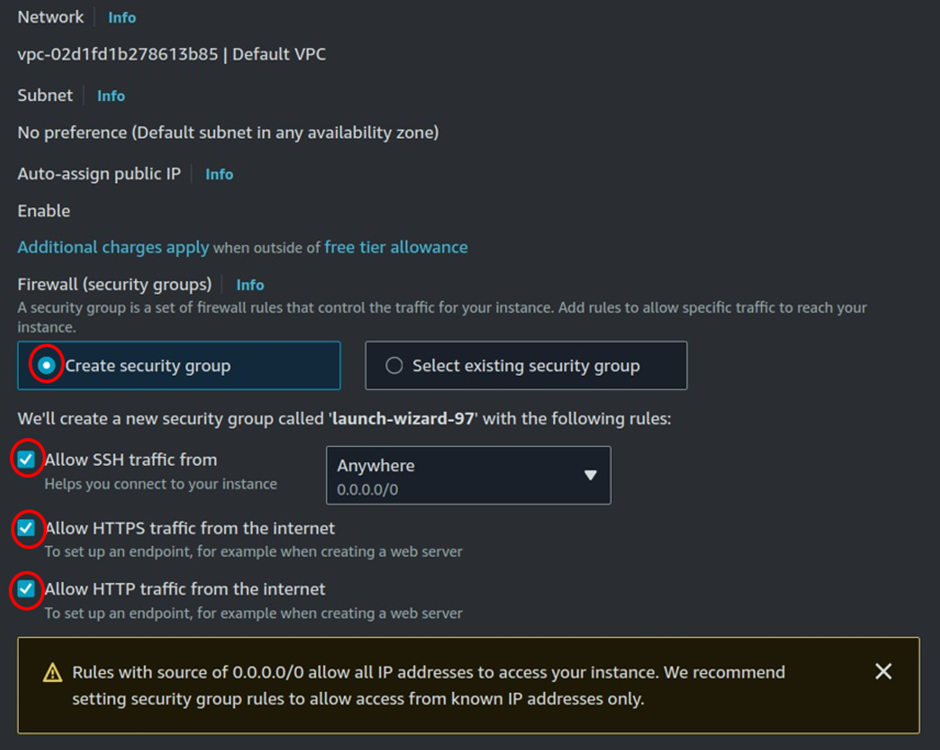
Under Firewall, select the Create New Security Group radio button. Then, open the following ports for SSH, HTTP, and HTTPS:
- Port 22 for SSH
- Port 80 for HTTP
- Port 443 for HTTPS
Always remember to follow best practices when configuring SSH ports by limiting access to your IP address.
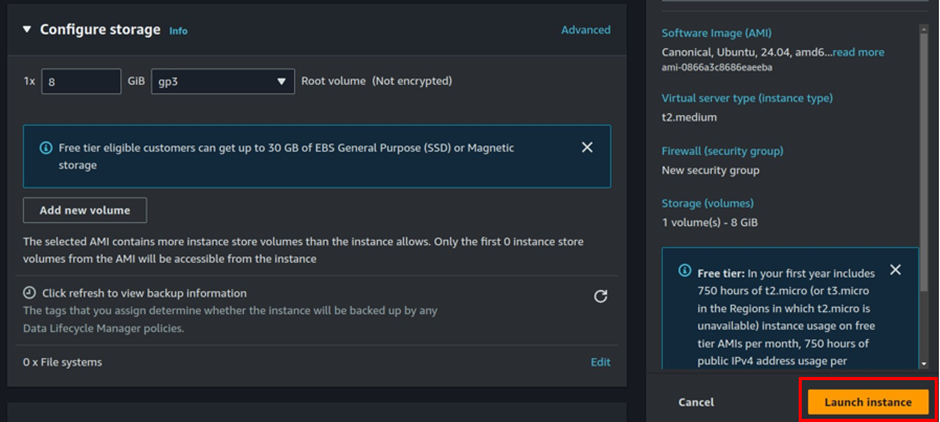
Leave storage as default, then review and click launch instance.
After launching the instance, we will adjust its security groups by opening port 3000 for Grafana.
Click on the Instance ID, then scroll down to the Security section. Next, click on the Security Group associated with the instance.

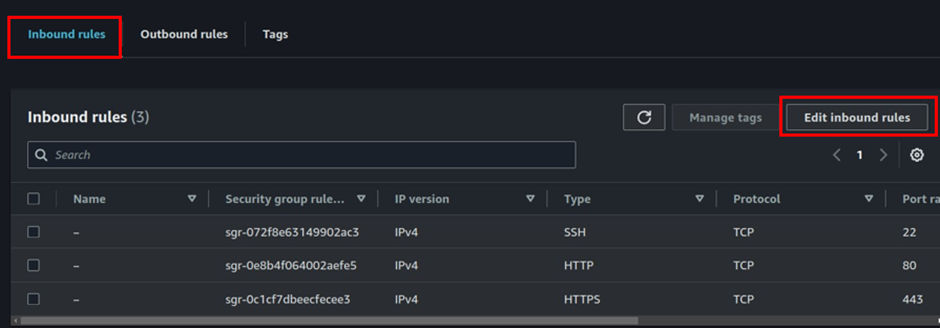
Go to the Inbound Rules tab and click on Edit Inbound Rules.
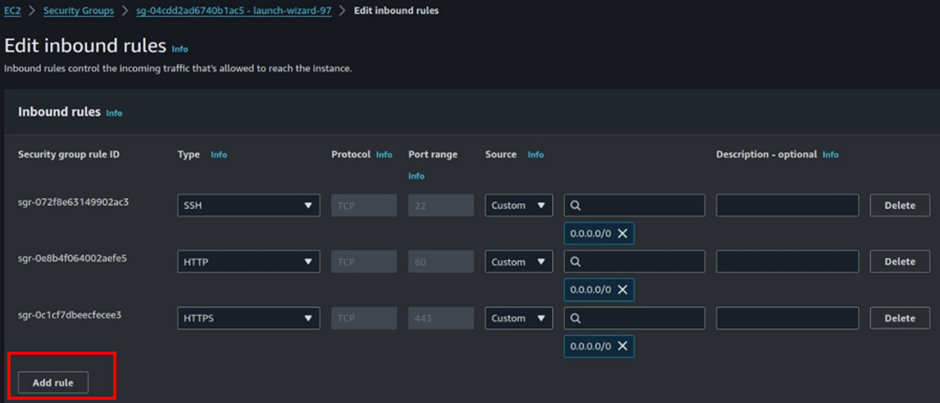
In the Edit Inbound Rules dashboard, click on Add Rule.
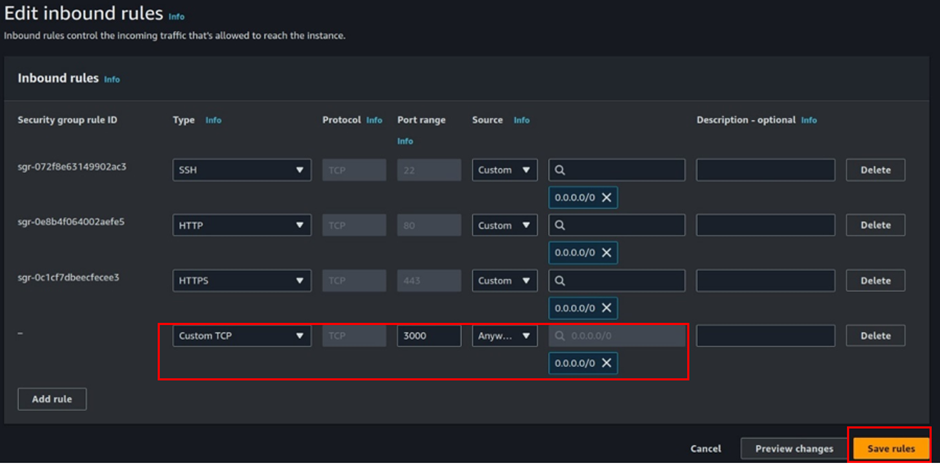
In the Port Range section, enter 3000, then click on Save Changes. This completes the process of modifying the security group settings.
Now is the time to install Grafana, SSH into your instance by entering this command in your terminal.
# ssh -i <key.pem> user@publicIP
# your code should look like this.
ssh -i web-SSHkeys.pem ubuntu@44.212.29.235
Run the system update then paste in this command to install Grafana.
# command for updte
sudo apt update
# command to install grafana
wget  https://dl.grafana.com/enterprise/release/grafana-enterprise-11.1.0.linux-amd64.tar.gz
tar -xvzf grafana-enterprise-11.1.0.linux-amd64.tar.gz
cd grafana-v11.1.0/bin
./grafana-server &
Access Grafana: Open your web browser
http://<your-server-ip>:3000
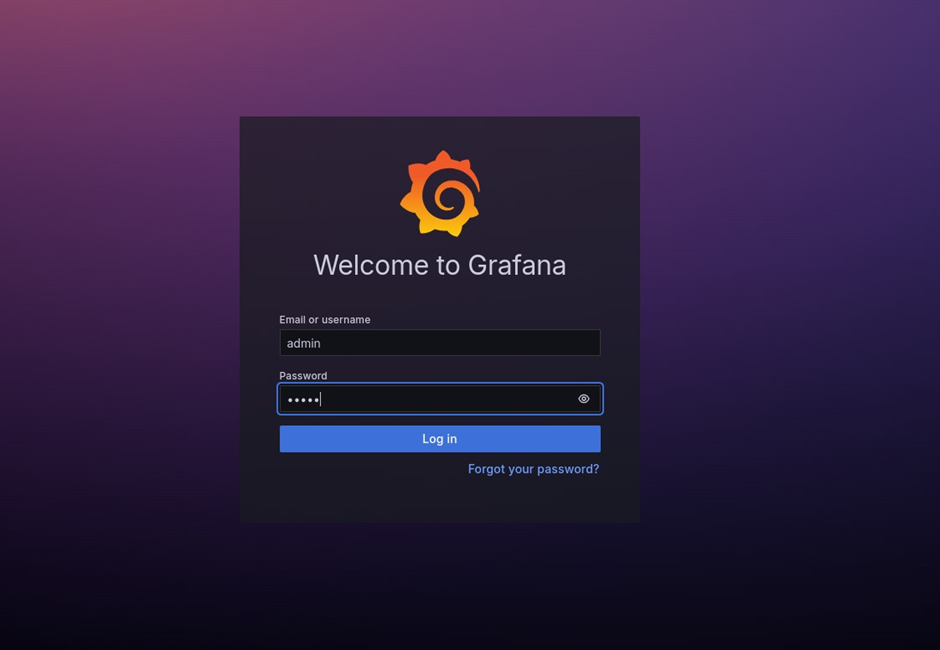
# Login using the default credentials (admin/admin)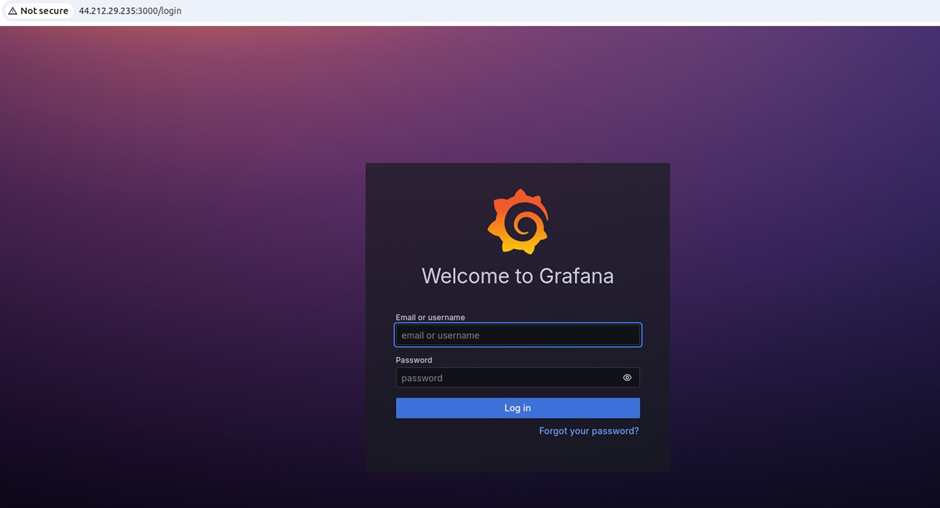
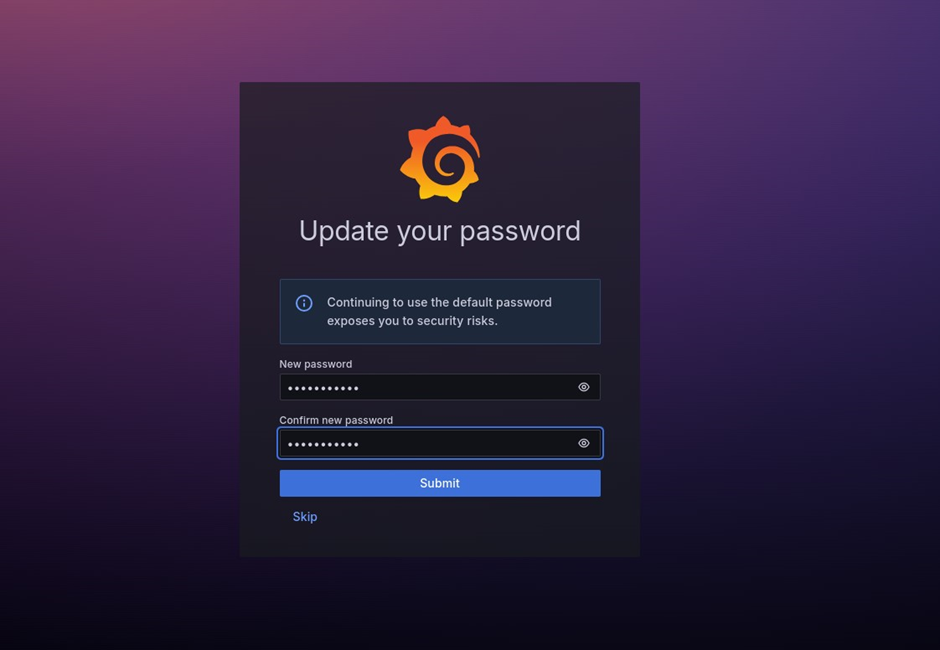
Update your new password.
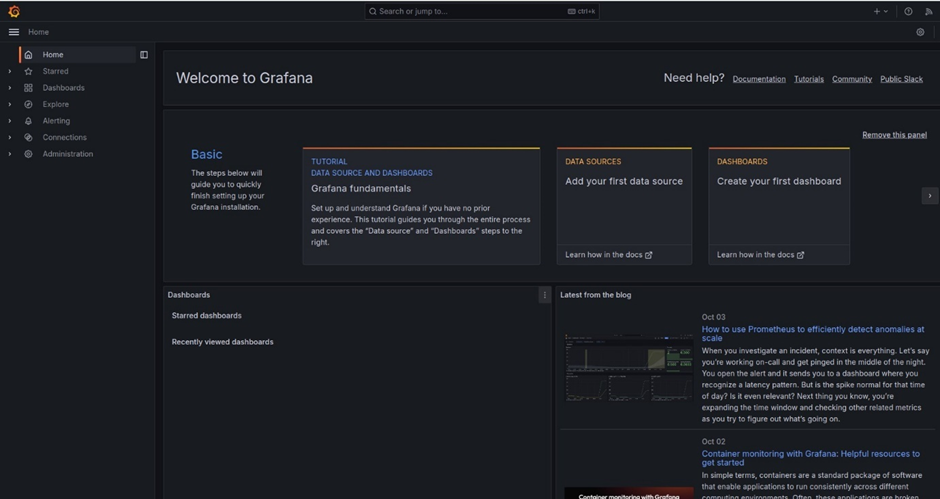
Adding CloudWatch as a Data Source
Grafana can integrate with AWS CloudWatch to visualize metrics from your AWS services.
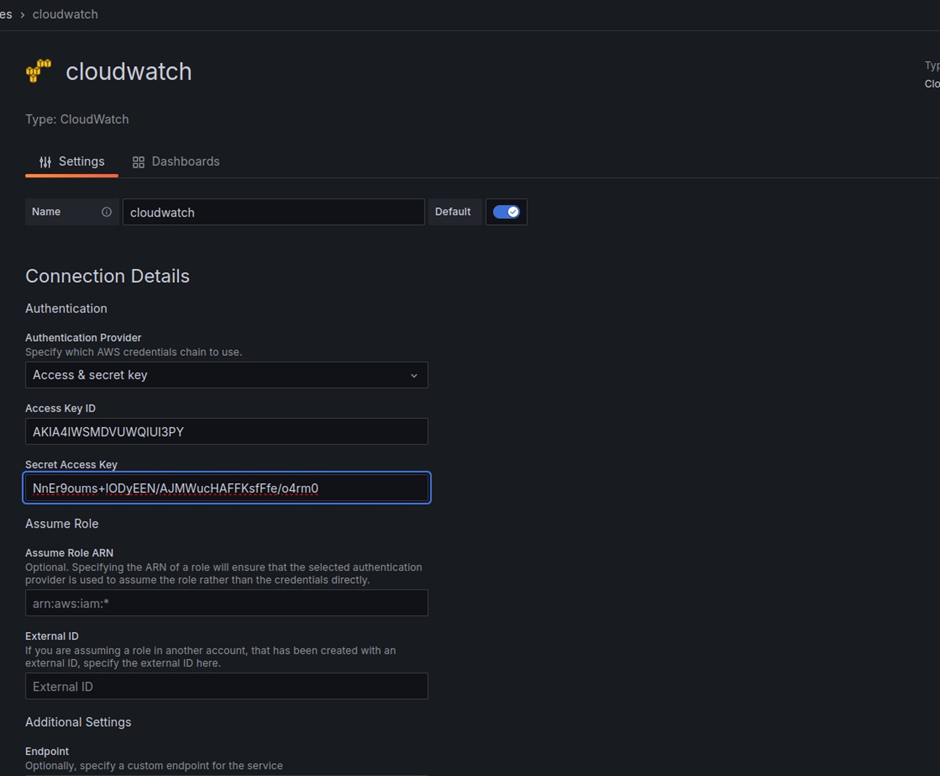
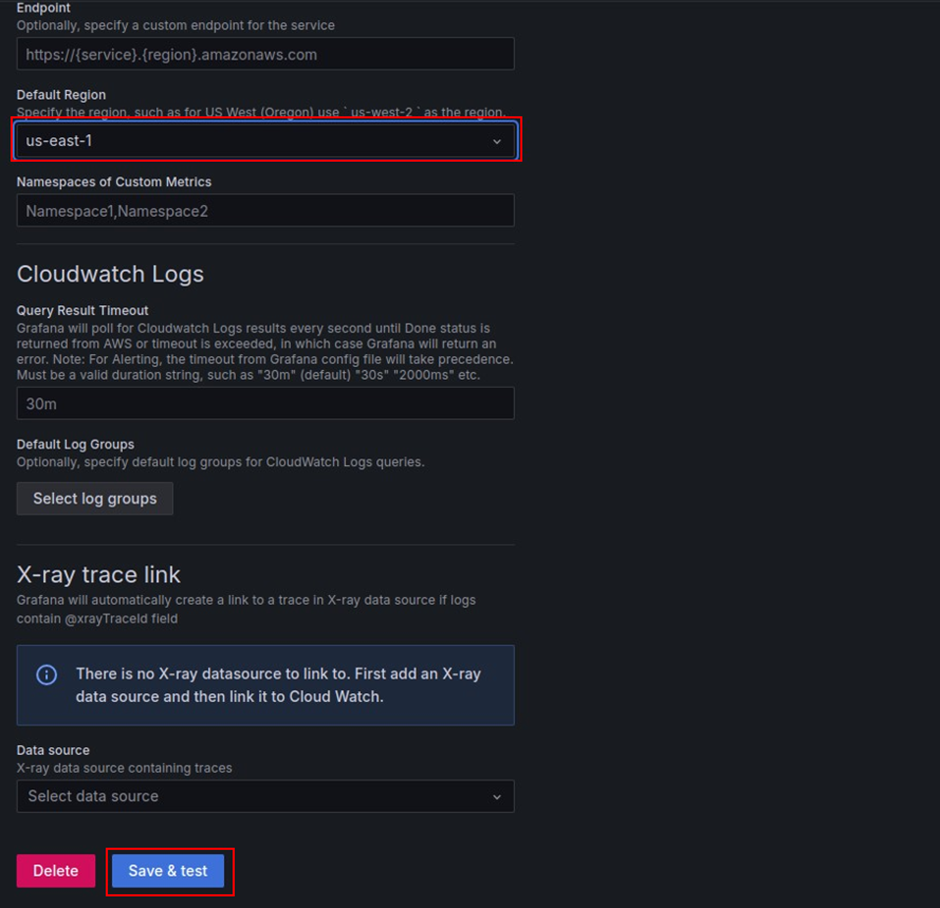
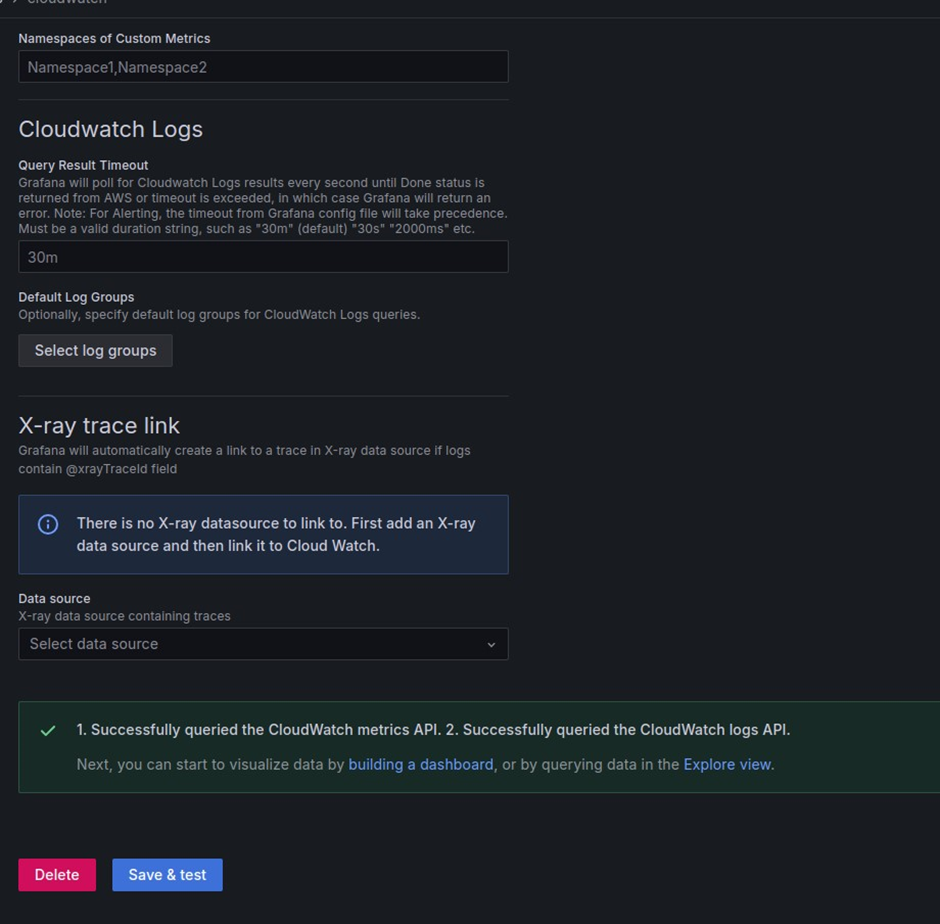
Add Data Source: In Grafana, go to the Left panel> Connections > Data Sources and click Add data source. Select CloudWatch from the list.


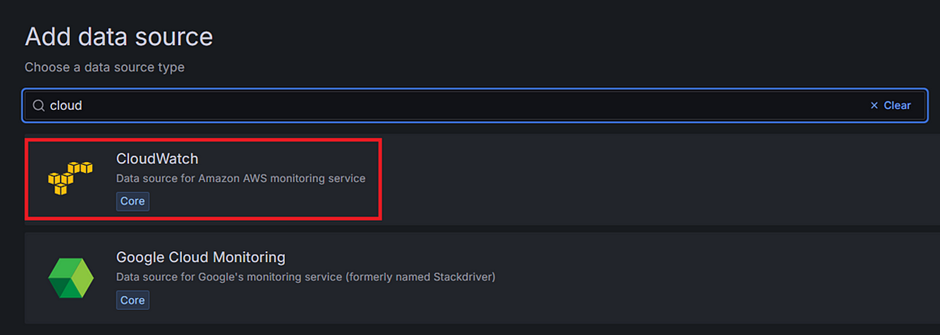
Configure CloudWatch: Enter your AWS credentials, specify the default region, and save the data source.
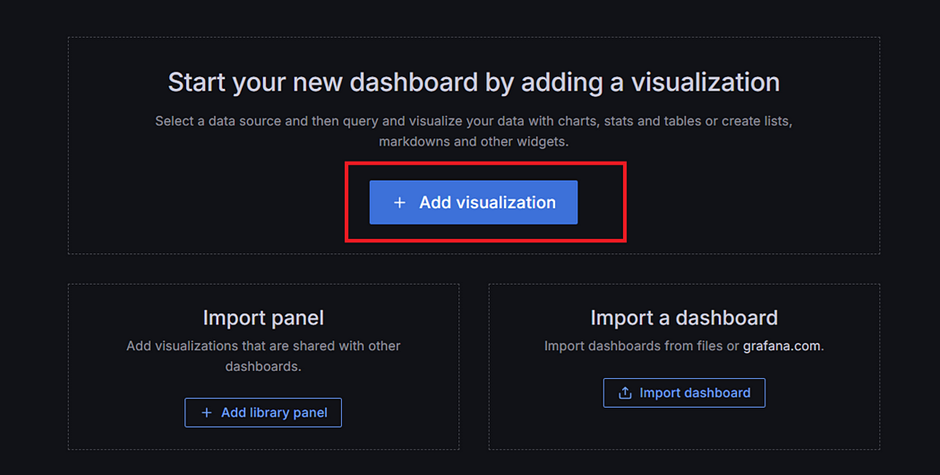
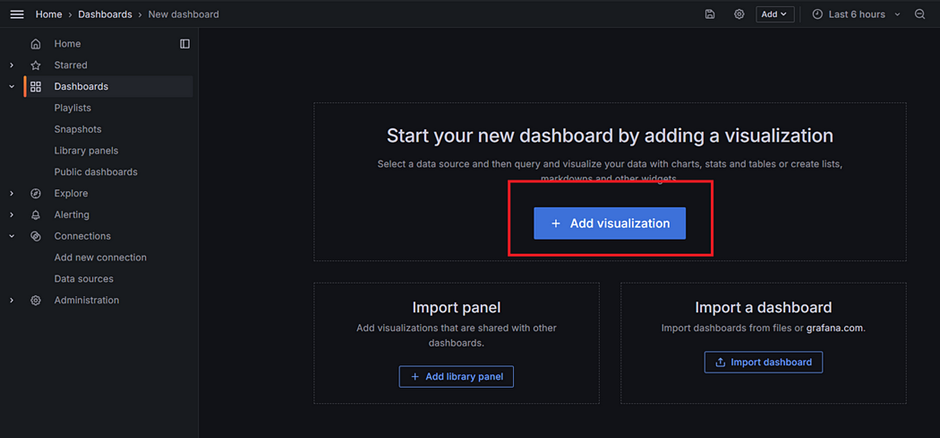
Creating a Dashboard for EC2 MetricsCreate Dashboard: Click on the Dashboards icon in the sidebar and select New.

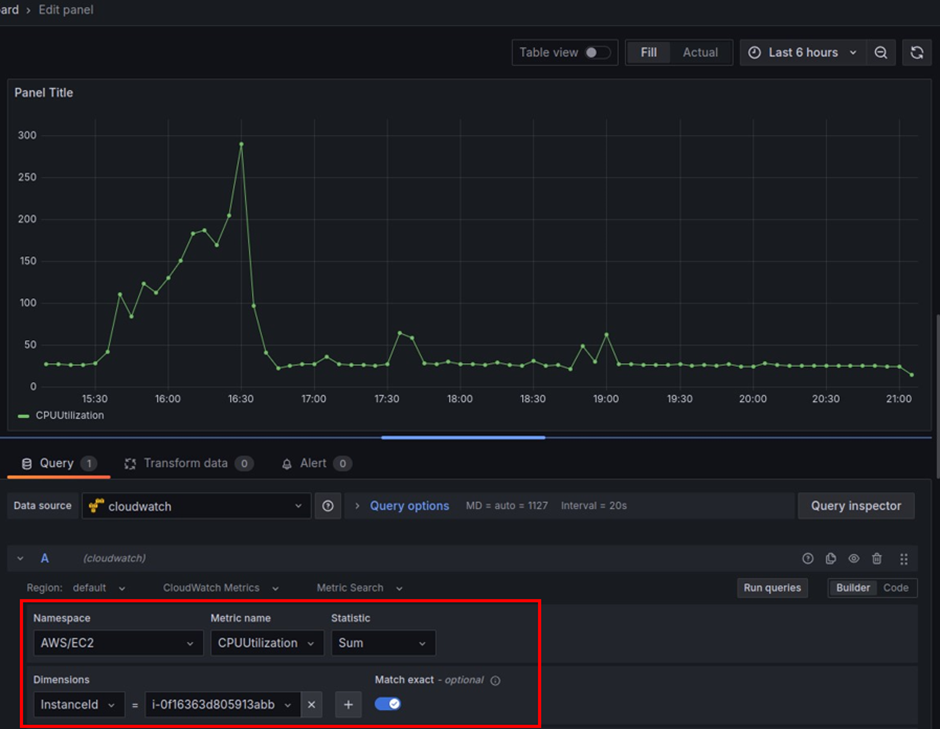
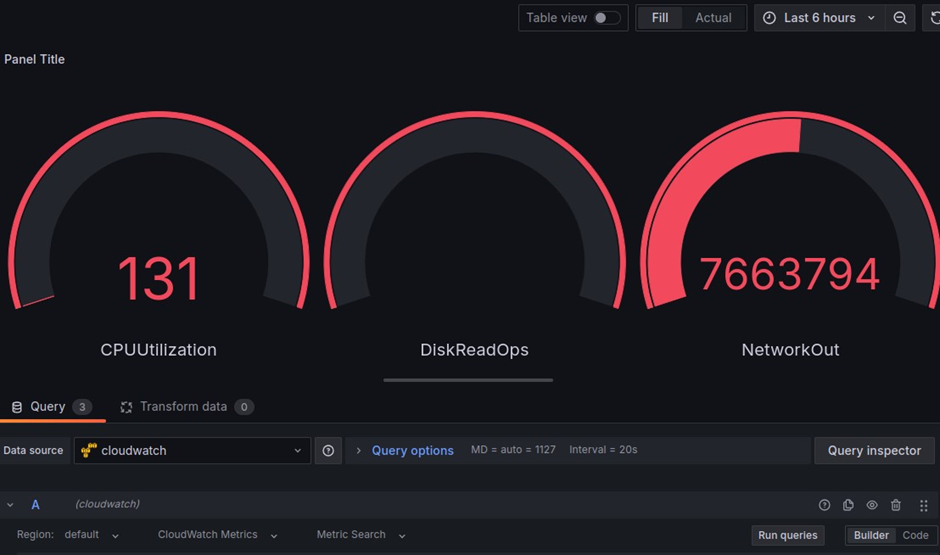
Add Panels: Click Add visualization, select CloudWatch-metrics as the data source, and configure queries to fetch metrics for your EC2 instances, such as CPU utilization and network traffic.

Here we have configured the first query to fetch CPU utilization of our EC2 instance running in our default region from CloudWatch.
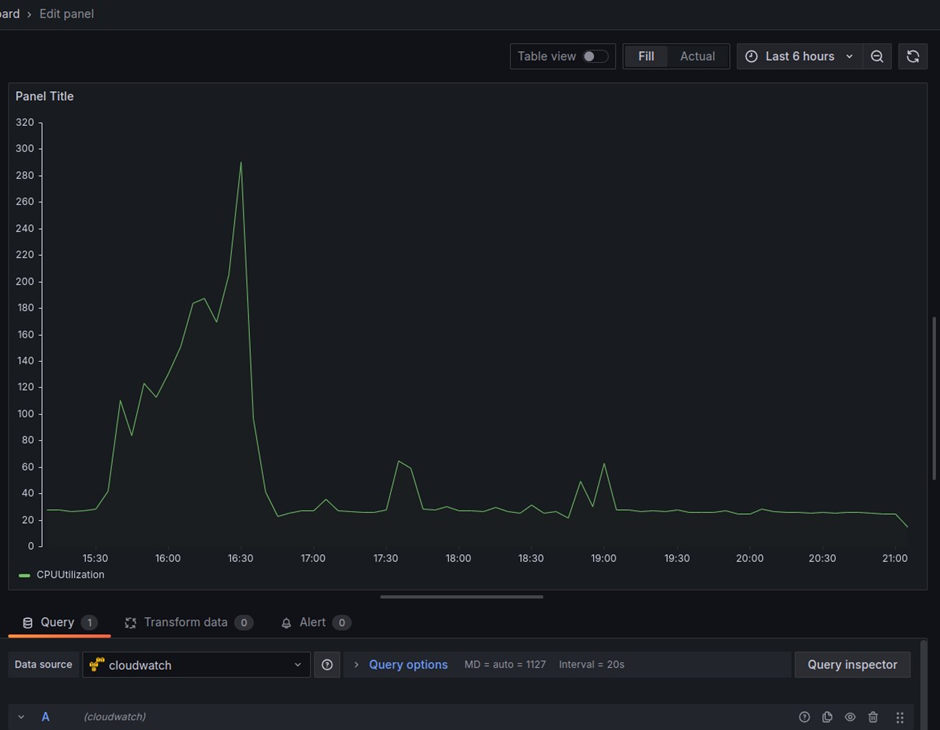
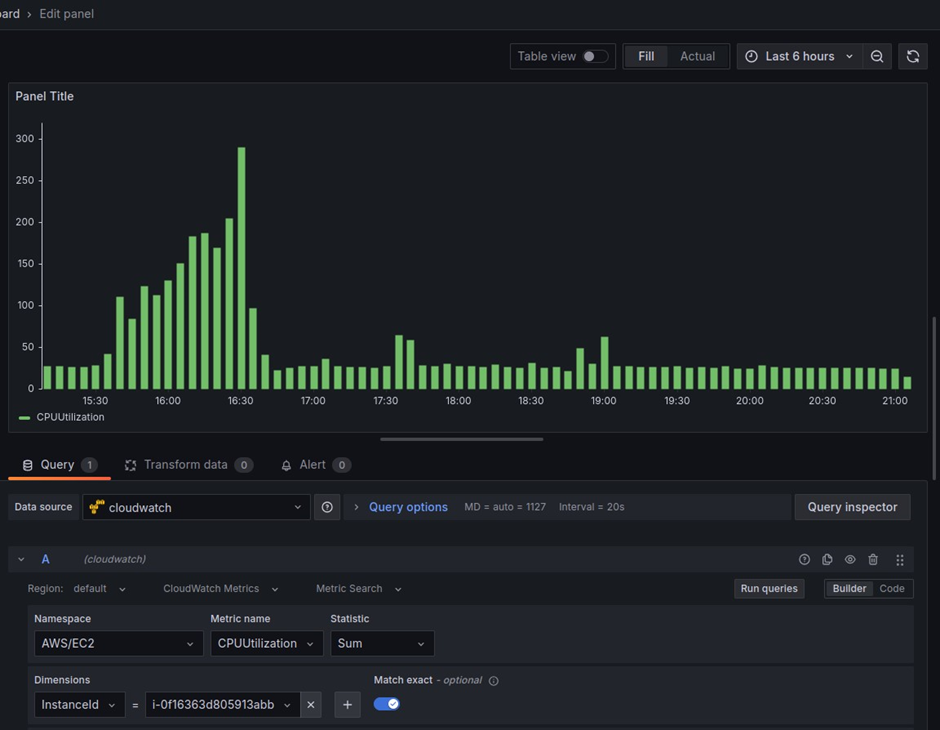
We can also change the display setting or visuals as below image.
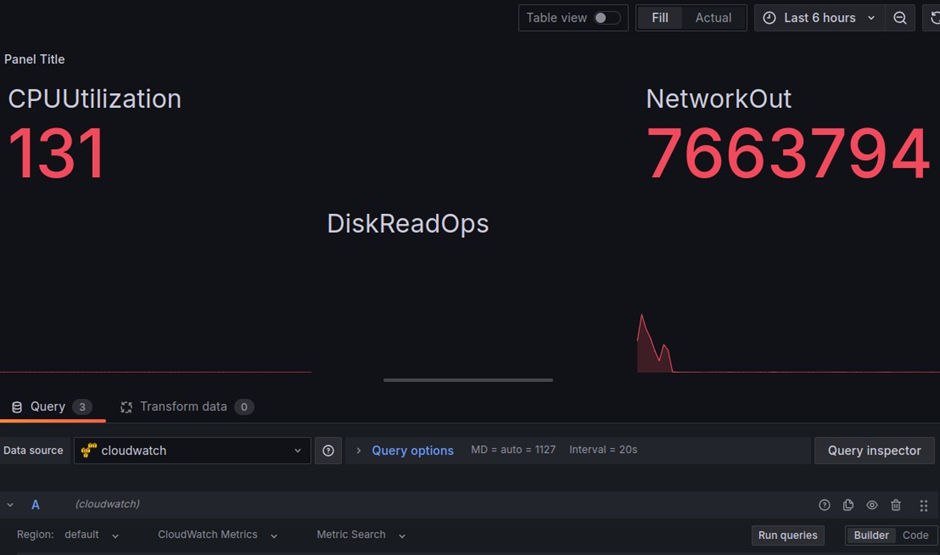
Similarly, we will add additional queries to fetch other metrics for this instance from CloudWatch, such as Network In/Out or Status Checks.
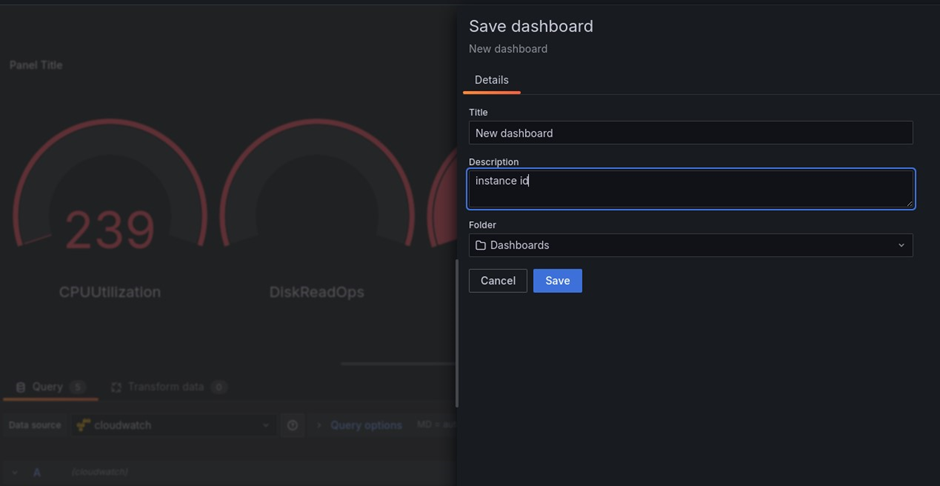
Now save the dashboard by clicking on the save option in the right corner.
Now save the dashboard by clicking on the save option in the right corner.
Adding Prometheus as a Data Source
Grafana also integrates seamlessly with Prometheus, a popular monitoring and alerting toolkit because Grafana cannot go to every system for fetching its metrics. Grafana can only fetch data from the Time-Series Database or final databases. For example, docker can expose its metrics without any agent tool but it cannot store that information in any database and Linux system uses an agent tool but again it cannot store data, this task is being done by Prometheus and that’s why Grafana contact Prometheus for fetching these metrics. Here’s how to set it up:
Before we proceed let’s first install Prometheus on our server. To install Prometheus, we will use this Schell script.
# Create a script
sudo vi prometheus.sh
# Then paste in this code.

#!/bin/bash

# Update package list
echo "Updating package list..."
sudo apt-get update -y

# Install dependencies
echo "Installing required dependencies..."
sudo apt-get install -y wget tar

# Create a Prometheus user
echo "Creating Prometheus user..."
sudo useradd --no-create-home --shell /bin/false prometheus

# Create necessary directories
echo "Creating necessary directories..."
sudo mkdir /etc/prometheus
sudo mkdir /var/lib/prometheus

# Set ownership of directories to Prometheus user
sudo chown prometheus:prometheus /etc/prometheus
sudo chown prometheus:prometheus /var/lib/prometheus

# Download Prometheus
echo "Downloading Prometheus..."
cd /tmp
wget https://github.com/prometheus/prometheus/releases/download/v2.45.0/prometheus-2.45.0.linux-amd64.tar.gz

# Extract Prometheus
echo "Extracting Prometheus..."
tar -xvf prometheus-2.45.0.linux-amd64.tar.gz

# Move binaries to the appropriate location
echo "Moving Prometheus binaries..."
cd prometheus-2.45.0.linux-amd64
sudo mv prometheus /usr/local/bin/
sudo mv promtool /usr/local/bin/

# Set ownership of binaries
sudo chown prometheus:prometheus /usr/local/bin/prometheus
sudo chown prometheus:prometheus /usr/local/bin/promtool

# Move Prometheus configuration files
echo "Moving configuration files..."
sudo mv consoles /etc/prometheus
sudo mv console_libraries /etc/prometheus
sudo mv prometheus.yml /etc/prometheus

# Set ownership of config files
sudo chown -R prometheus:prometheus /etc/prometheus

# Create a systemd service file for Prometheus
echo "Creating Prometheus service file..."
sudo tee /etc/systemd/system/prometheus.service > /dev/null <<EOL
[Unit]
Description=Prometheus
Wants=network-online.target
After=network-online.target

[Service]
User=prometheus
Group=prometheus
Type=simple
ExecStart=/usr/local/bin/prometheus \\
  --config.file=/etc/prometheus/prometheus.yml \\
  --storage.tsdb.path=/var/lib/prometheus/ \\
  --web.console.templates=/etc/prometheus/consoles \\
  --web.console.libraries=/etc/prometheus/console_libraries

[Install]
WantedBy=multi-user.target
EOL

# Reload systemd and start Prometheus
echo "Reloading systemd and starting Prometheus..."
sudo systemctl daemon-reload
sudo systemctl start prometheus
sudo systemctl enable prometheus

# Confirm Prometheus is running
echo "Prometheus installation complete. Checking Prometheus status..."
sudo systemctl status prometheus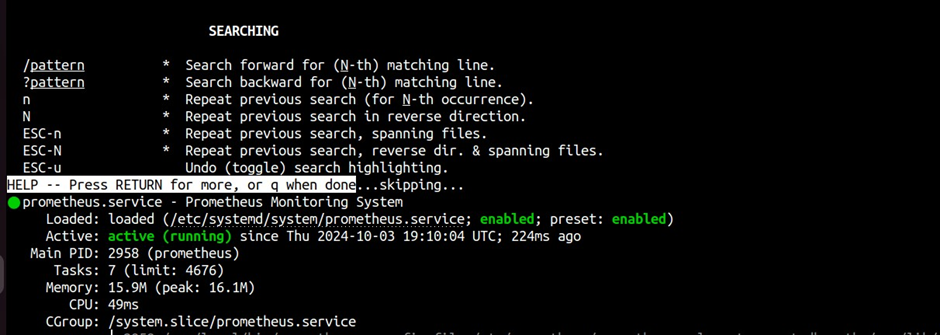
After successfully installing Prometheus, it will be listening on port 9090. To ensure access, adjust your security group’s inbound rules by opening port 9090.
Add Data Source: In Grafana, go to Left Sidebar> Connections > Data Source and click Add data source. Type Prometheus in the search bar then select Prometheus from the list.
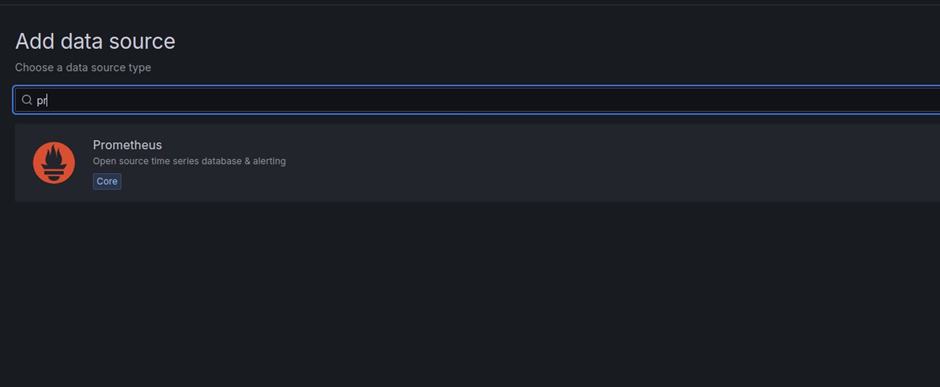
Configure Prometheus: Enter the URL of your Prometheus server
# e.g., http://<prometheus-server-ip>:9090
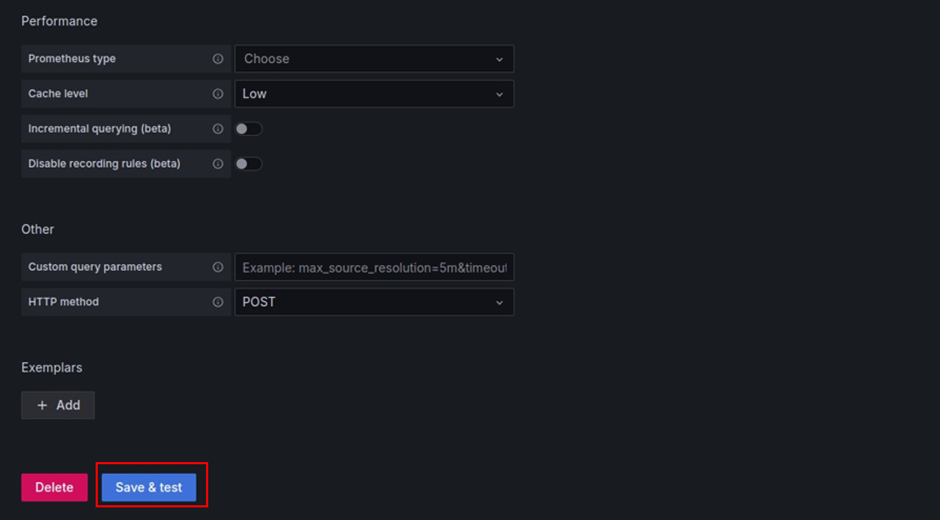
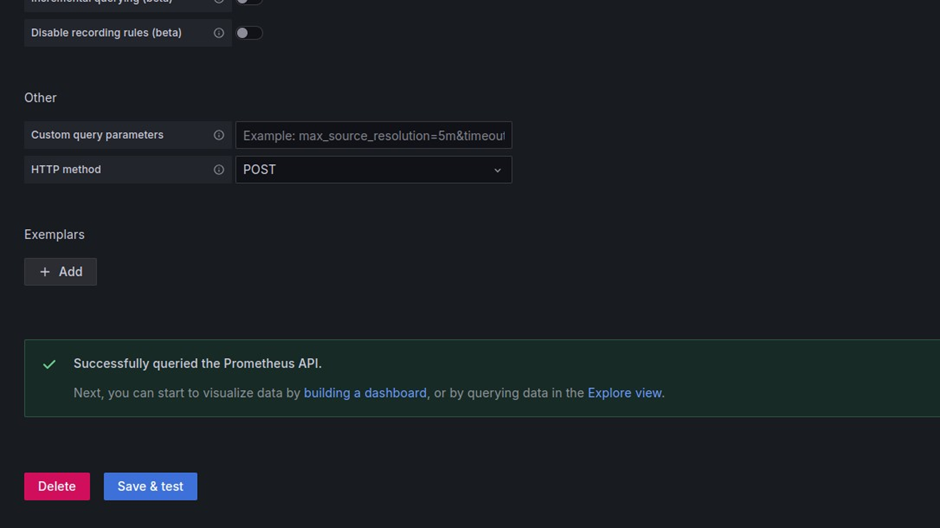
#save the data source.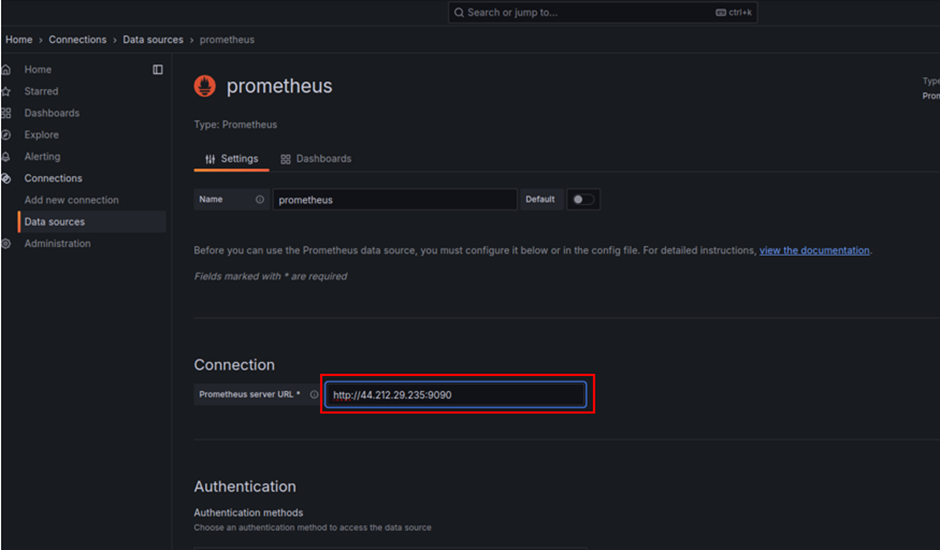
Configure Prometheus to Monitor Docker Engine
Docker Settings: Wewill use a Schell script to install docker using your Favorite editor and create a script docker.sh then paste in the below command.
sudo vi docker.sh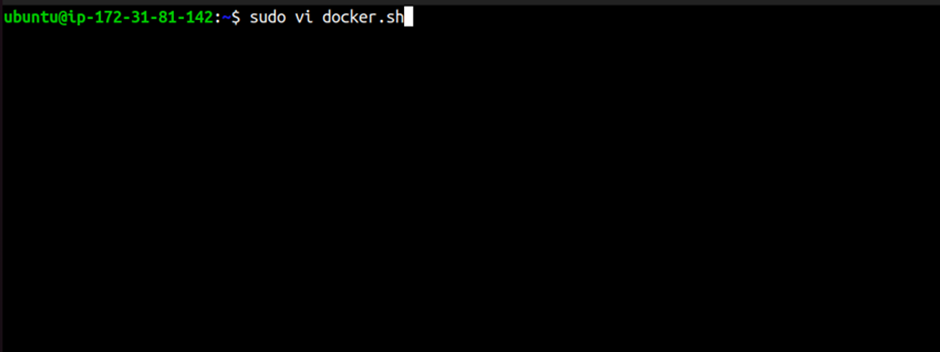
#!/bin/bash

# Update the apt package index
echo "Updating package index..."
sudo apt-get update -y

# Install required packages to allow apt to use a repository over HTTPS
echo "Installing required packages..."
sudo apt-get install -y \
    apt-transport-https \
    ca-certificates \
    curl \
    software-properties-common

# Add Docker’s official GPG key
echo "Adding Docker's official GPG key..."
curl -fsSL https://download.docker.com/linux/ubuntu/gpg | sudo gpg --dearmor -o /usr/share/keyrings/docker-archive-keyring.gpg

# Set up the stable repository
echo "Adding Docker repository to sources list..."
echo \
  "deb [arch=$(dpkg --print-architecture) signed-by=/usr/share/keyrings/docker-archive-keyring.gpg] https://download.docker.com/linux/ubuntu \
  $(lsb_release -cs) stable" | sudo tee /etc/apt/sources.list.d/docker.list > /dev/null

# Update the apt package index again
echo "Updating package index again..."
sudo apt-get update -y

# Install Docker Engine
echo "Installing Docker..."
sudo apt-get install -y docker-ce docker-ce-cli containerd.io

# Start Docker
echo "Starting Docker service..."
sudo systemctl start docker

# Enable Docker to start on boot
echo "Enabling Docker to start on boot..."
sudo systemctl enable docker

# Add the current user to the docker group
echo "Adding current user to Docker group..."
sudo usermod -aG docker $USER

# Inform the user to log out and back in
echo "Docker installed successfully! Please log out and back in for group changes to take effect."

# Verify Docker installation
sudo docker –version
make the docker script executable.
sudo chmod +x docker.sh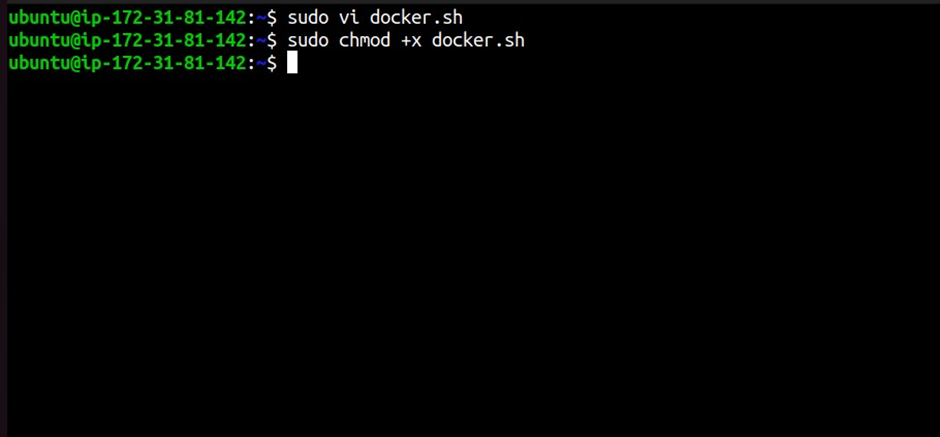
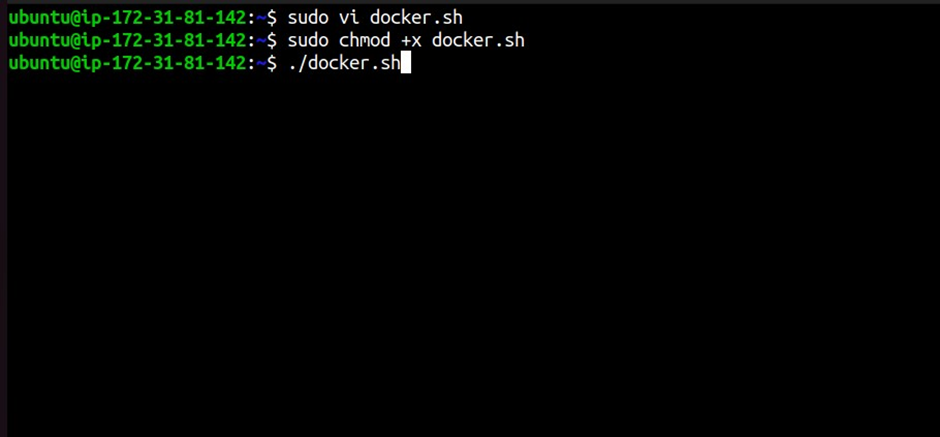
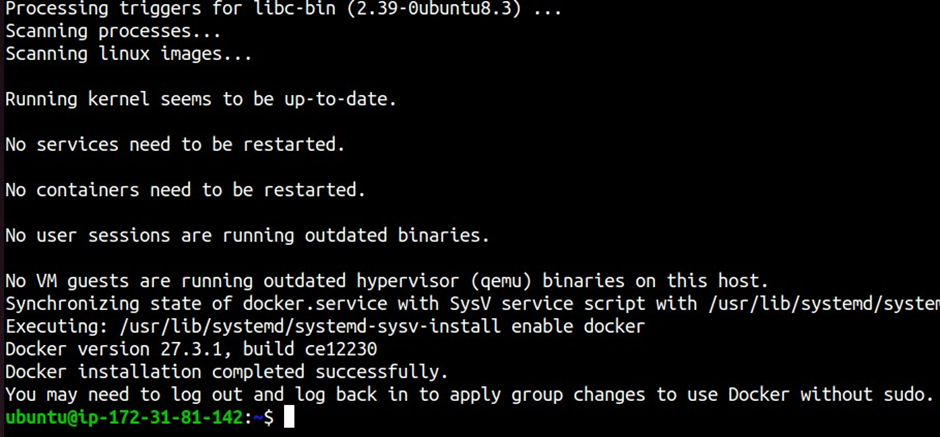
We can see we have successfully installed docker.
Configure docker engine to expose the metrics as docker is self capable of exposing its metrics.
You can do that by running the below Schell script.
#!/bin/bash

# Configure Docker to expose metrics on port 9323
echo "Configuring Docker to expose metrics..."

# Create or update the /etc/docker/daemon.json file
cat << EOF | sudo tee /etc/docker/daemon.json > /dev/null
{
  "metrics-addr": "0.0.0.0:9323"
}
EOF

# Restart Docker to apply changes
echo "Restarting Docker to apply changes..."
sudo systemctl restart docker

# Confirm that Docker is running and exposing metrics
echo "Docker is now configured to expose metrics on port 9323."
Or you can also do it manually through your vi editor
sudo vi /etc/docker/daemon.json
# paste in this code in your editor
{
  "metrics-addr": "0.0.0.0:9323"
}
# save then restart docker
sudo systemctl restart docker
This will enable Docker to expose its metrics on port 9323.
Go ahead and adjust your security group by opening port 9323 in your EC2 Instance Security Group.
Go to the EC2 Dashboard.
Click on Instances, select your instance, and click on the Security section.
Under Security Groups, click on the linked Security Group ID.
In the Inbound Rules tab, click Edit Inbound Rules.
Click Add Rule:
- Type: Custom TCP Rule
- Port Range: 9323
- Source: 0.0.0.0/0 (or restrict to your specific IP for security).
Click Save Rules.
Launch some docker containers also. Some of them should start and some of them should be stopped.
Again, create a script container.sh make it executable then run it.
Paste in the below code to create the containers.
#!/bin/bash

# Define the image and container base name
IMAGE="nginx"    # You can change this to any other image, like "ubuntu" or "alpine"
CONTAINER_BASENAME="my-container"

# Launch 7 containers
for i in {1..7}
do
  CONTAINER_NAME="${CONTAINER_BASENAME}-${i}"
  echo "Launching container: $CONTAINER_NAME"

  # Run the container in detached mode (-d) and give it a unique name
  docker run -d --name "$CONTAINER_NAME" "$IMAGE"

  # Optionally, you can expose ports by adding -p (example: -p 808$i:80)
  # docker run -d --name "$CONTAINER_NAME" -p 808$i:80 "$IMAGE"
done

echo "All 7 containers launched."
Confirm the containers were launched.
docker ps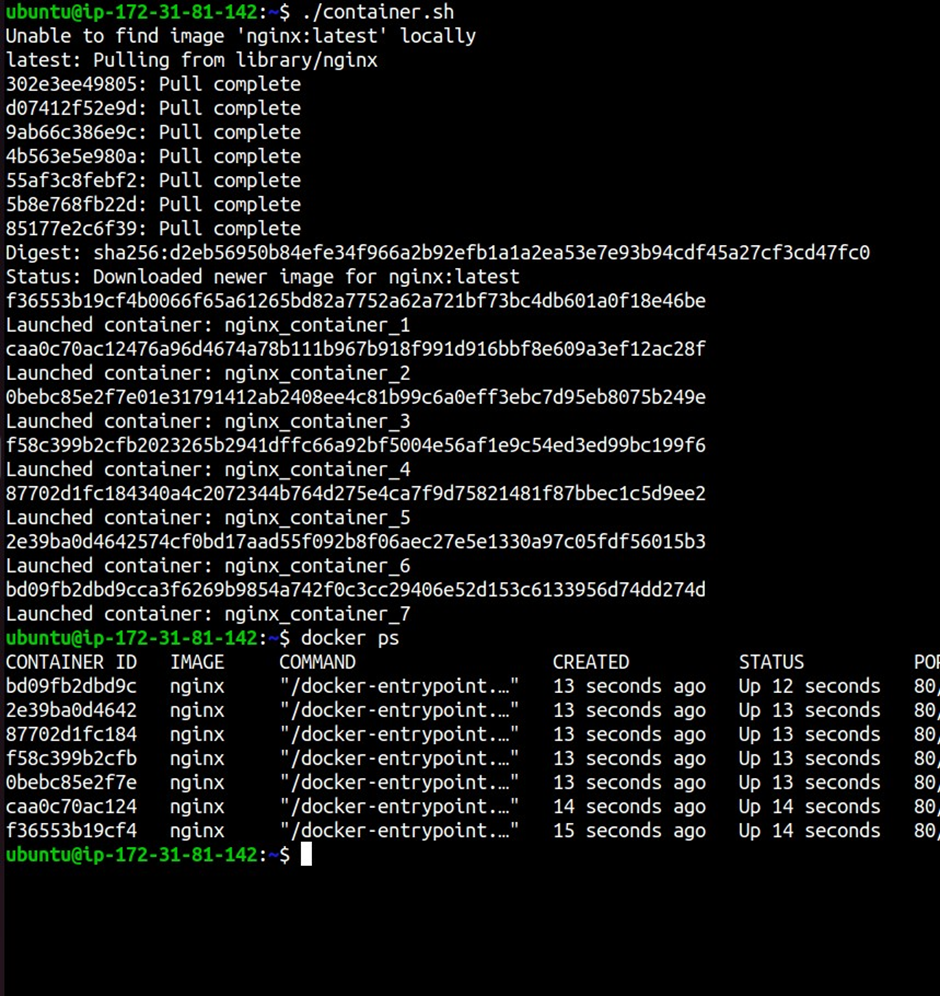
Prometheus Settings:
Go to the configuration file of the Prometheus, prometheus.yml, and configure it appropriately.
sudo vi /etc/prometheus/prometheus.yml
scrape_configs:
  - job_name: "Docker-Metrics"
    static_configs:
      - targets: ["52.87.165.181:9323"]
        labels:
          Env: Production
          Region: US-East-1
          Location: USA
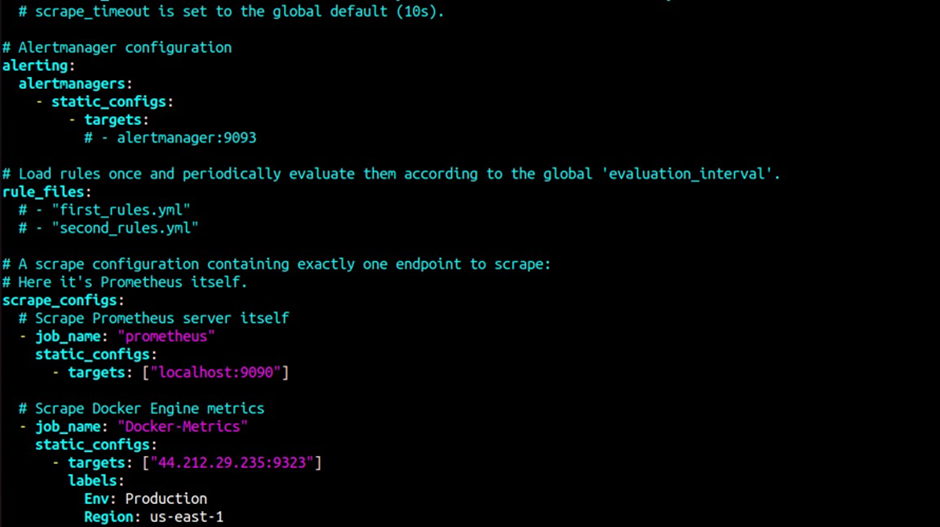
Restart Prometheus to apply the new configuration: by running the below command.
sudo systemctl restart prometheus
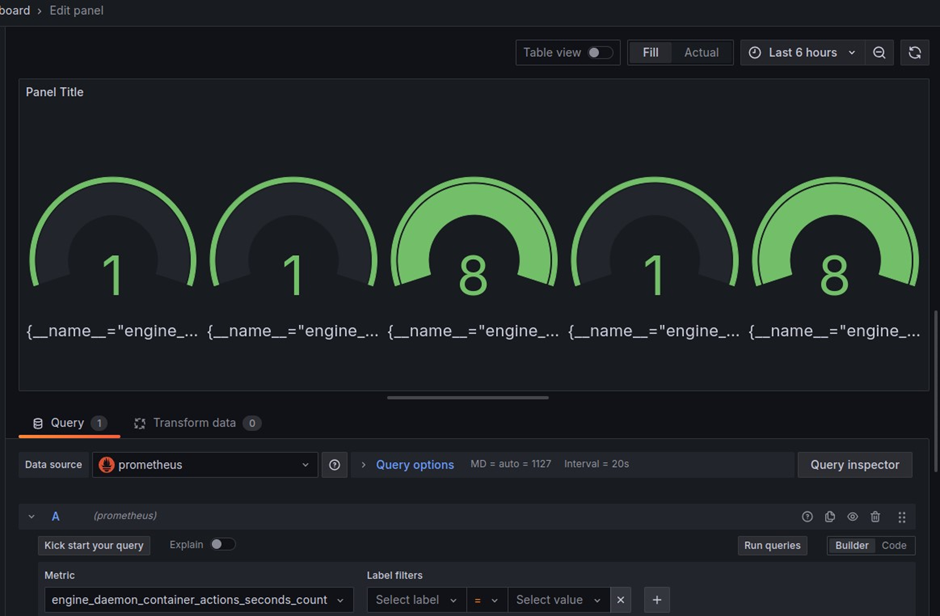
Create Docker Monitoring DashboardAdd Panels: Click Add new panel, select Prometheus as the data source, and configure queries to fetch metrics related to the Docker engine, such as Container states and memory usage.


We are putting the first query to fetch the total number of containers.
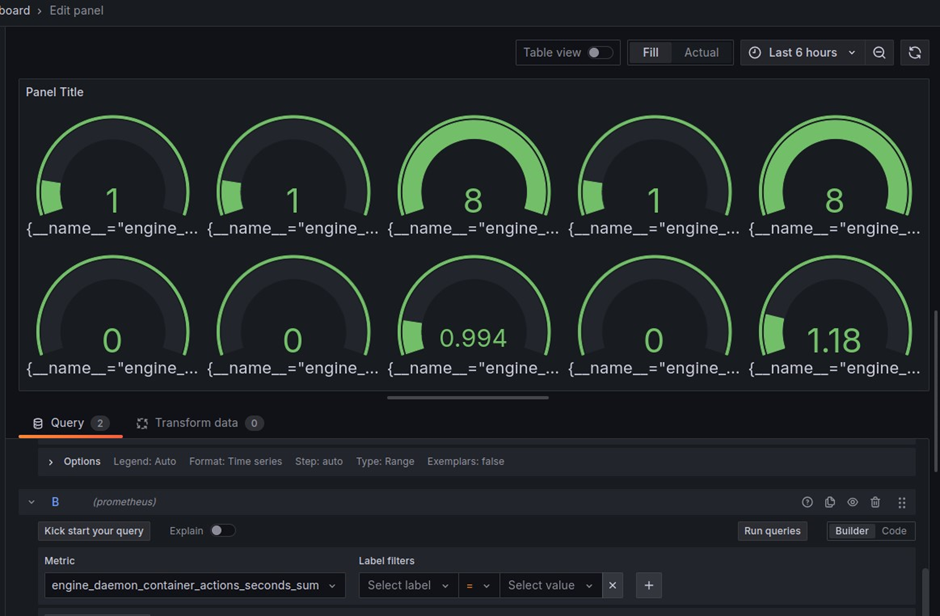
Similarly, we will add some more queries to fetch more metrics of the docker engine via Prometheus.
Configure Prometheus to Monitor Linux System
Go to the Target system and install agent node exporter which will expose the metrics from that system.
wget https://github.com/prometheus/node_exporter/releases/download/v1.8.2/node_exporter-1.8.2.linux-amd64.tar.gz
 tar -xvzf node_exporter-1.8.2.linux-amd64.tar.gz
 cd node_exporter-1.8.2.linux-amd64/
 ./node_exporter &
or you can create the below Schell script.
vi install_node_exporter.shpaste the below bash script in your editor.
#!/bin/bash

# Define the version and download URL
VERSION="1.8.2"
DOWNLOAD_URL="https://github.com/prometheus/node_exporter/releases/download/v${VERSION}/node_exporter-${VERSION}.linux-amd64.tar.gz"

# Download node_exporter
echo "Downloading Node Exporter version ${VERSION}..."
wget $DOWNLOAD_URL

# Extract the downloaded tar file
echo "Extracting Node Exporter..."
tar -xvzf node_exporter-${VERSION}.linux-amd64.tar.gz

# Navigate into the extracted directory
cd node_exporter-${VERSION}.linux-amd64/

# Start node_exporter in the background
echo "Starting Node Exporter..."
./node_exporter &

# Inform the user
echo "Node Exporter has been installed and is running on port 9100."
chmod +x install_node_exporter.sh
./install_node_exporter.sh
Again, go back to the EC2 security group and open port 9100.
Go to the prometheus server and configure the prometheus.yml file.
sudo vi /etc/prometheus/prometheus.yml

scrape_configs:
  - job_name: "Node Exporter"
    static_configs:
      - targets: ["<target_system_IP>:9100"]
        labels:
          Env: Production
          Region: US-East-1
          Location: USA
Save the changes to the configuration file
press Esc, then type:wq!
# hit Enter
# Restart Prometheus to apply the new configuration:
sudo systemctl restart prometheus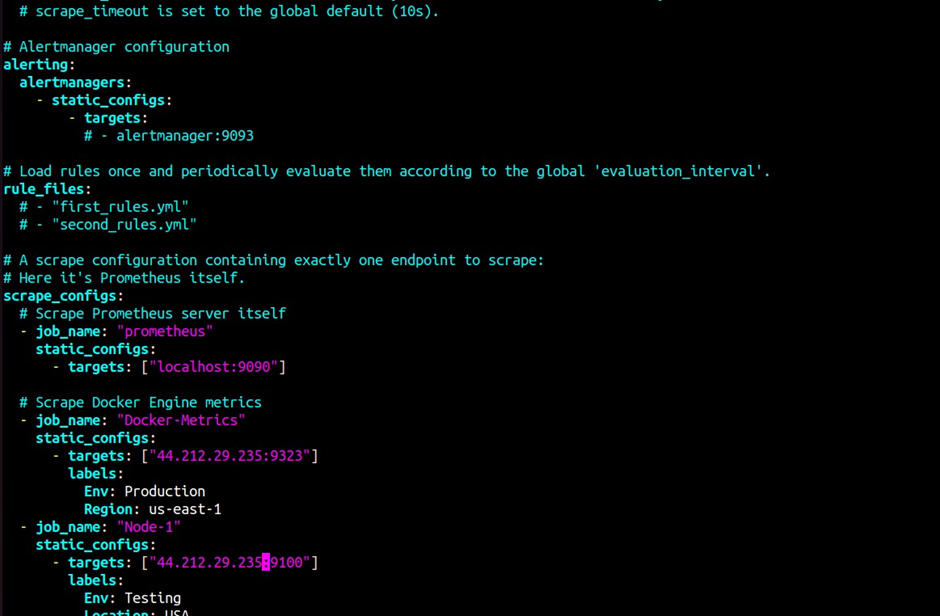
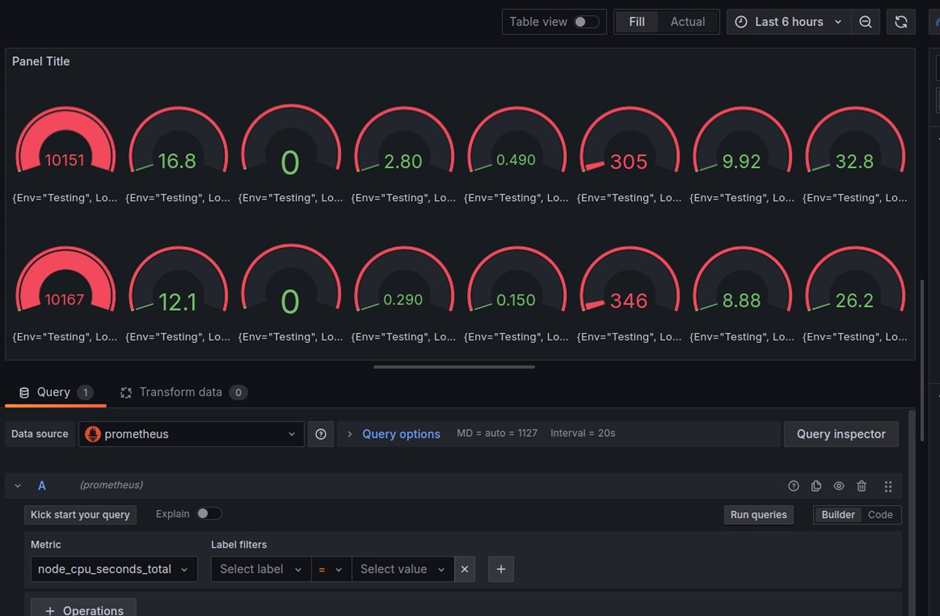
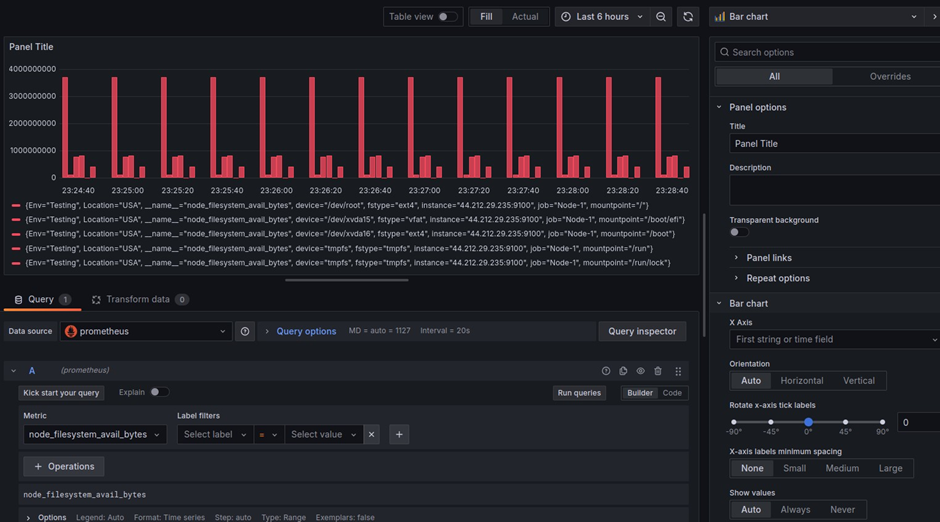
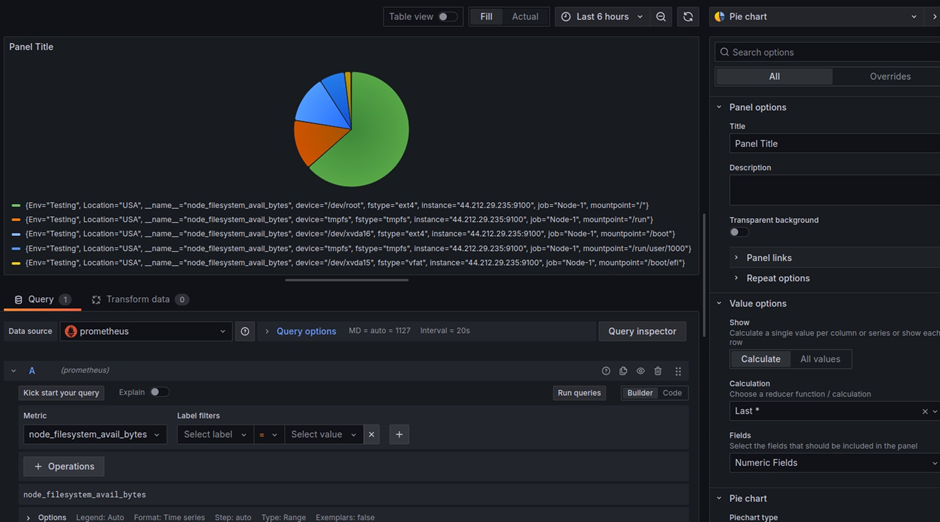
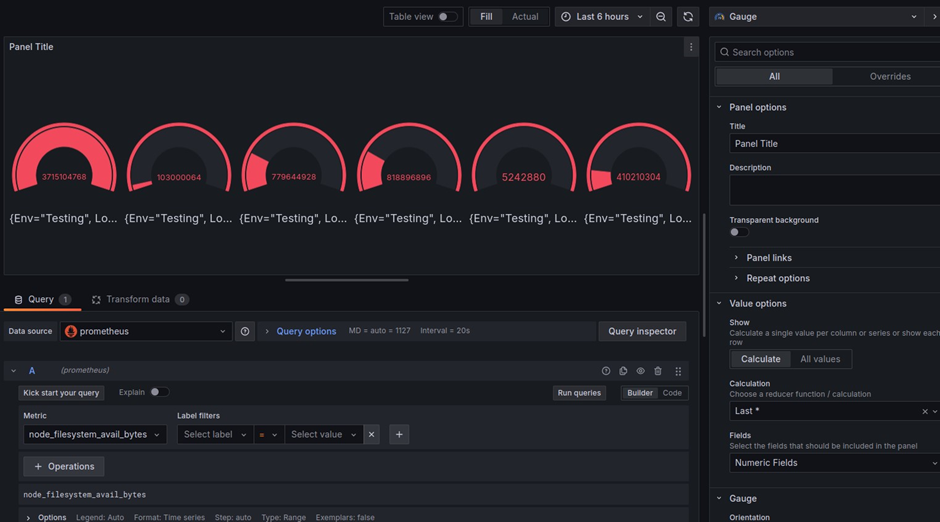
Add Panels: Click Add new panel, select Prometheus as the data source, and configure queries to fetch metrics related to the node, such as system load and disk usage.

We will put various queries like total seconds CPU used, memory available, Space available, total seconds CPU is idle, etc.
Again, you can save this dashboard.
Conclusion
Grafana makes it easy to build comprehensive, real-time dashboards that give you valuable insights into your infrastructure and applications. Whether you’re keeping an eye on EC2 instances or monitoring Docker containers, Grafana’s flexibility and user-friendly interface ensure that you can visualize your data effortlessly. It’s an essential tool that empowers you to stay on top of your system’s performance and make informed decisions quickly.
Thanks for reading and stay tuned for more.

A skilled Cloud DevOps Engineer and Solutions Architect specializing in infrastructure provisioning and automation, with a focus on building scalable, fault-tolerant, and secure cloud environments.

